GIS: Breast Cancer Incidence Rate
I made this map in GIS class. With Mrs. Burgess, this class will help me in the future for reading different kind of maps. i chose this particular project because i thought i would be interesting, what was statistics of breast cancer in 2007. also how cancer is a many women also men.
Making this map, was fun and very difficult at the same time. while looking for the right information and how it would be work with Mapsource at first we need to propose the topic and the information we need to be approved. Cancer is one of the biggest disit that many people are afraid to die from. eating and taking care of each will prevent from it. I chose this particular piece of work to be my "Best Work" because i enjoy the classroom, learn while creating the maps, also because i created a map that people can see the statistic of breast cancer.
It taught me a lot how to create a map and read the legend, before i had no idea how to read a map, thanks to Mrs Burgess now i know what and how too. It also taught me that I don't have to be very good at something to be able to make something great, it takes time and hard work to
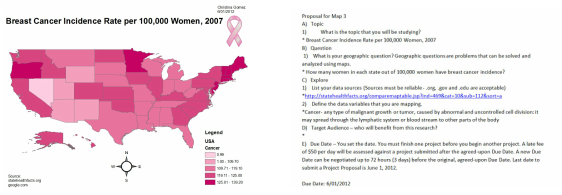
accomplish whatever I put in my mind. at first we had to propose the topic and source used, after being approved by the teacher. as well to define the topic of the map, for example; cancer-is the uncontrolled growth of abnormal cells in the body. Now start to find and collect the right data, map temples and organize the colors the wanted to be. After collecting the data, now transfer the templet wanted to be used, in this case i used United States, to Mapsource. Next will be putting the title legend, source, name, and compass. After that its been saved as a jpg, is a commonly used method of lossy compression for photography or images to be seen clear. Something that i found surprising was that i didnt really needed help, also that i would off finished making a map in just few days and start with the next independent map. Another thing was how the data was a little complicated, find the right statistics. The knowledge i gain from these project was, time management, depend on myself and somewhat on the teacher. It will help me on collge by tuning in my work on time. at the same time gain extrinsic knowledge by learning to better understand to reading of maps and to complete my work.
In conclusion, if i had the opportunity to improve my map. I would make a world wide breast cancer incidence rate. It would've taken me more time but its worth taking these class, and i enjoy ; learning about maps.
Making this map, was fun and very difficult at the same time. while looking for the right information and how it would be work with Mapsource at first we need to propose the topic and the information we need to be approved. Cancer is one of the biggest disit that many people are afraid to die from. eating and taking care of each will prevent from it. I chose this particular piece of work to be my "Best Work" because i enjoy the classroom, learn while creating the maps, also because i created a map that people can see the statistic of breast cancer.
It taught me a lot how to create a map and read the legend, before i had no idea how to read a map, thanks to Mrs Burgess now i know what and how too. It also taught me that I don't have to be very good at something to be able to make something great, it takes time and hard work to
accomplish whatever I put in my mind. at first we had to propose the topic and source used, after being approved by the teacher. as well to define the topic of the map, for example; cancer-is the uncontrolled growth of abnormal cells in the body. Now start to find and collect the right data, map temples and organize the colors the wanted to be. After collecting the data, now transfer the templet wanted to be used, in this case i used United States, to Mapsource. Next will be putting the title legend, source, name, and compass. After that its been saved as a jpg, is a commonly used method of lossy compression for photography or images to be seen clear. Something that i found surprising was that i didnt really needed help, also that i would off finished making a map in just few days and start with the next independent map. Another thing was how the data was a little complicated, find the right statistics. The knowledge i gain from these project was, time management, depend on myself and somewhat on the teacher. It will help me on collge by tuning in my work on time. at the same time gain extrinsic knowledge by learning to better understand to reading of maps and to complete my work.
In conclusion, if i had the opportunity to improve my map. I would make a world wide breast cancer incidence rate. It would've taken me more time but its worth taking these class, and i enjoy ; learning about maps.
